How to read your passive house energy monitoring data

A basic energy monitoring system measures electricity consumption in kilowatt-hours (kWh) – the same unit that appears on your electricity bill. More sophisticated systems break that consumption down by circuit, so you can see how much energy individual appliances or rooms are using. Some systems also monitor solar generation and battery state of charge, giving you a complete picture of the home’s energy flows at any given time.
In a passive house, the numbers are typically much lower than in a conventional home, which is exactly the point. But understanding what’s normal for your home is the first step toward identifying anything that isn’t.
The baseline: what normal looks like
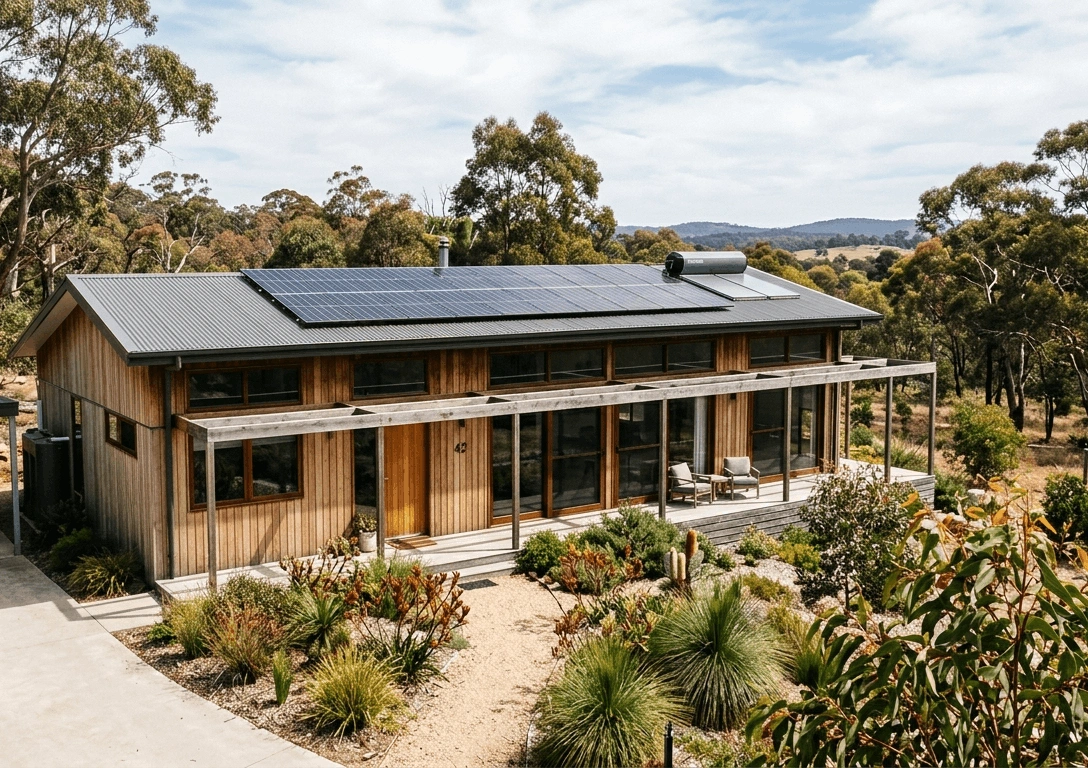
Every passive house design in Australia has a characteristic energy profile. That’s the pattern of consumption that reflects its size, its climate, its occupants’ habits and the efficiency of its systems. Establishing what normal looks like for your home is the foundation of useful monitoring.
In a well-performing passive house, heating and cooling loads are minimal compared to a conventional home. The largest consistent loads are typically hot water, appliances and lighting. Your mechanical ventilation with heat recovery (MVHR) unit runs continuously but at very low power, typically 20 to 50 watts, depending on the unit and the speed setting. Cooking, laundry and hot water will show up as distinct peaks in your consumption data.
Spend a few weeks getting familiar with your home’s typical daily and weekly consumption patterns before drawing any conclusions. What does a weekday look like versus a weekend? What happens to consumption when the weather changes? How much does solar generation offset on a clear day versus an overcast one?
What the data can tell you
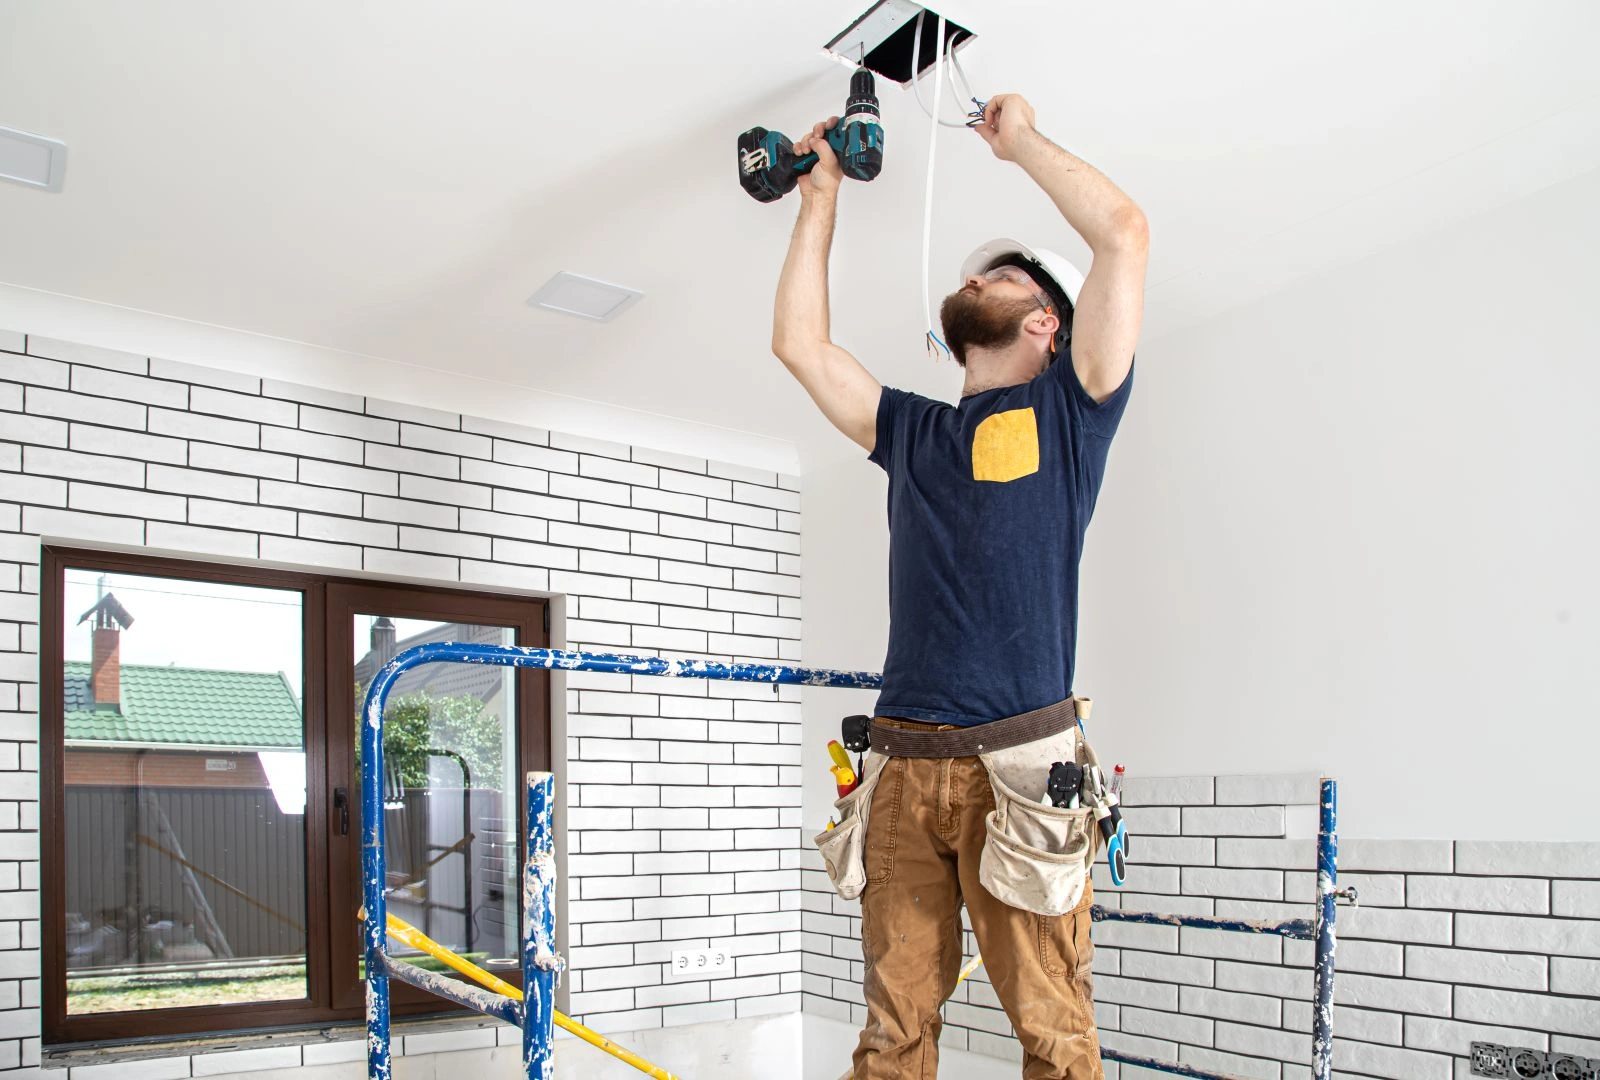
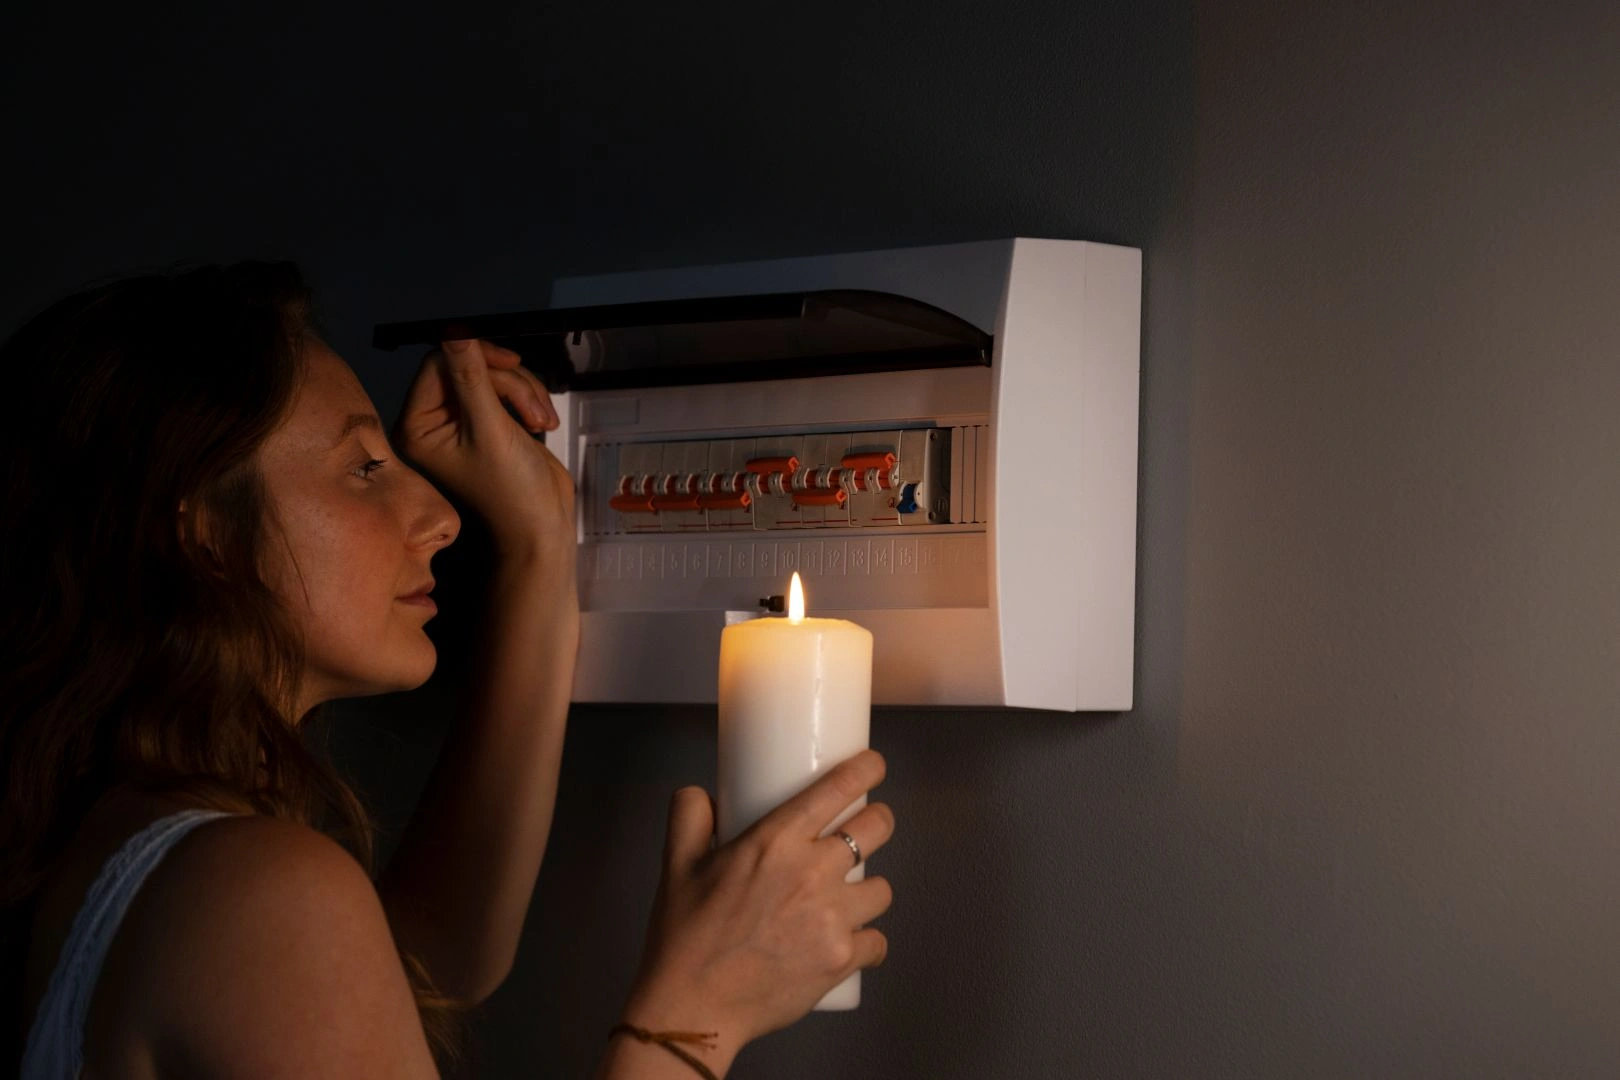
Once you know what normal looks like, deviations become important to note. A sudden increase in baseline consumption can indicate a problem. It could be something like a hot water heat pump that’s working harder than usual, an MVHR unit running at a higher speed than its normal setting, or a fridge that’s struggling with ambient temperatures. All of these will show up as elevated baseline consumption before they show up as a noticeable comfort issue.
This predictive quality is one of the genuine advantages of energy monitoring in a passive house design. Because the home’s normal consumption is so low, anomalies are easier to spot than they would be in a conventional home where overall consumption is higher and noisier.
Reading solar and battery data
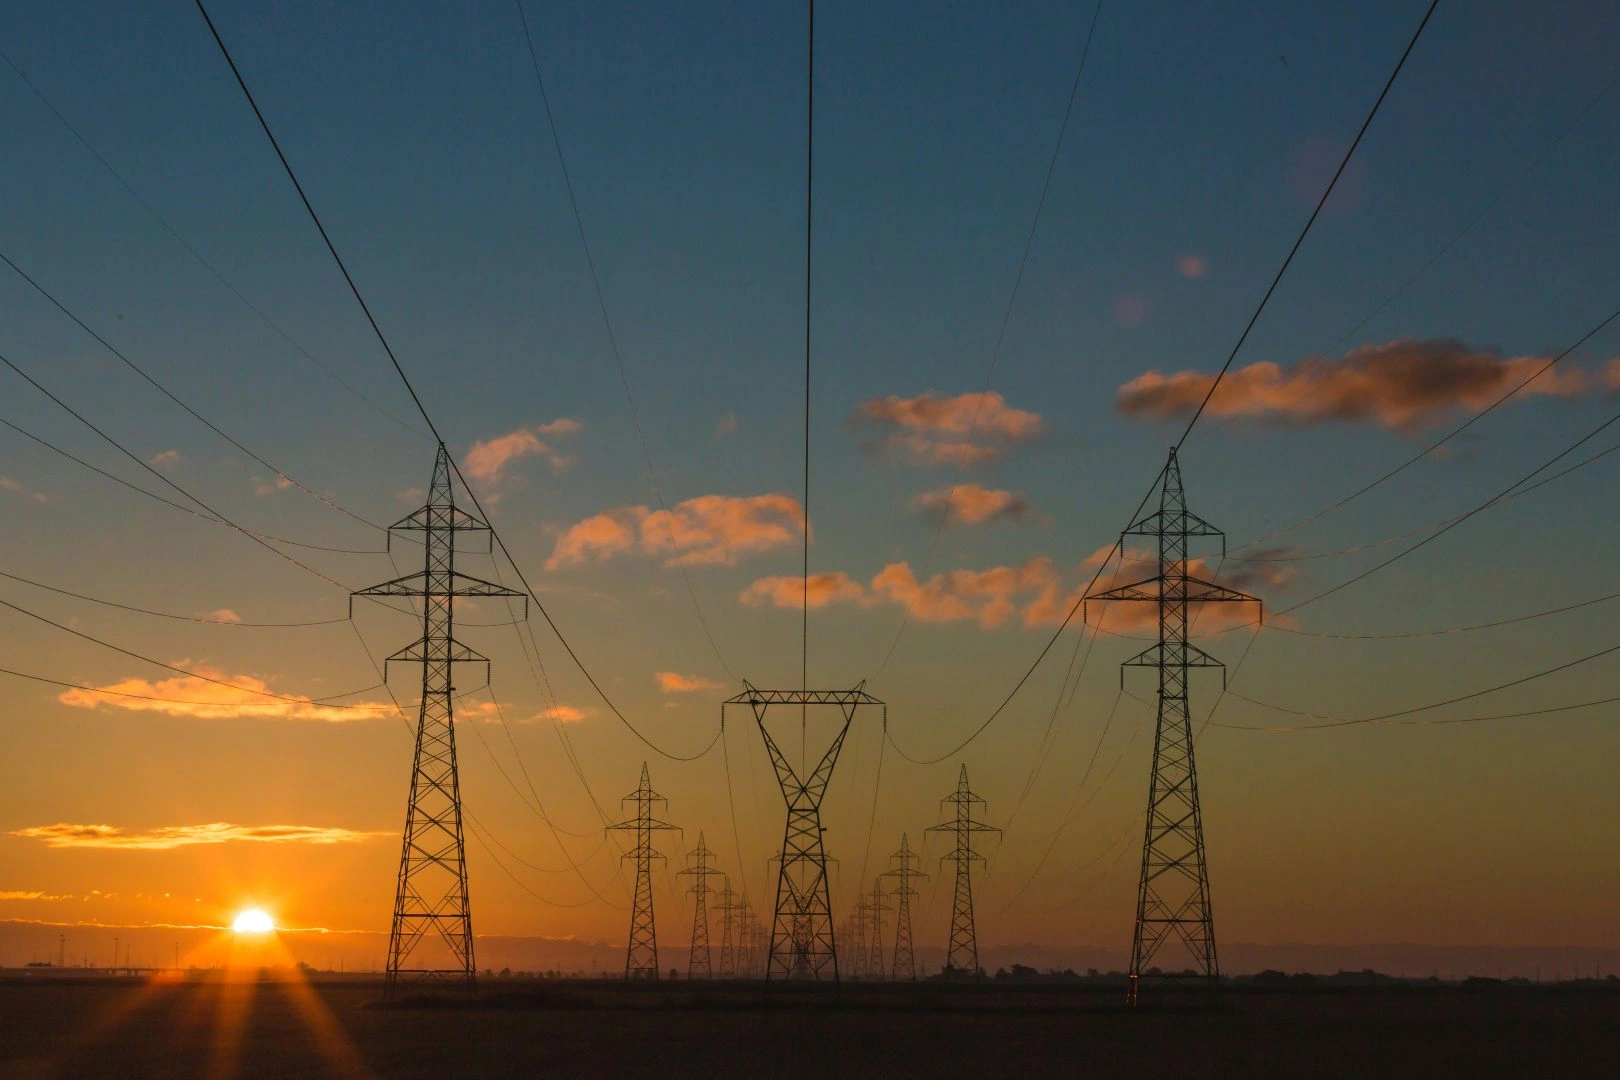
If your passive house in Australia is paired with rooftop solar and battery storage, your monitoring system will show you three things: how much solar energy you’re generating, how much of that generation you’re consuming directly and how much is being exported to the grid or stored in the battery.
The goal in a passive home is usually to maximise self-consumption, using as much of your own solar generation as possible rather than exporting it at low feed-in tariff rates. Your monitoring data makes this visible in real time. Running the dishwasher, washing machine or hot water boost during peak solar generation hours shifts load from grid electricity to free solar generation, and your monitoring data will show you exactly how effective that shift is.
Seasonal patterns in passive house data
A passive house design in Australia will show distinct seasonal patterns in its energy data, but they’ll be far less pronounced than in a conventional home. The heating load in winter will be low but visible. The cooling load in summer should be minimal to negligible. Hot water consumption will be relatively constant year-round.
If your winter heating consumption is significantly higher than your Passive House Planning Package (PHPP) model predicted, that’s worth investigating. It could indicate an airtightness issue, a problem with the MVHR system or a difference between predicted and actual occupant behaviour. Your passive house builder should be able to help you interpret the data in the context of the original design.
Making monitoring a useful habit
The most valuable thing you can do with your energy monitoring data is look at it regularly. A weekly check of total consumption, solar generation and any notable anomalies takes five minutes and builds the familiarity that makes the data genuinely useful over time.
Many monitoring platforms allow you to set consumption notifications if daily usage exceeds a threshold you define. In a passive house design in Australia, where baseline consumption is low and predictable, these alerts are an effective early warning system for problems that might otherwise go unnoticed until they show up as a comfort issue or an unexpected bill. The data your home produces is, in a sense, a conversation about how it’s performing. Learning to read it fluently is one of the most practical things you can do to get the most out of your passive house.